Key metrics row
version 0.1 Read time 1m 41s
Purpose
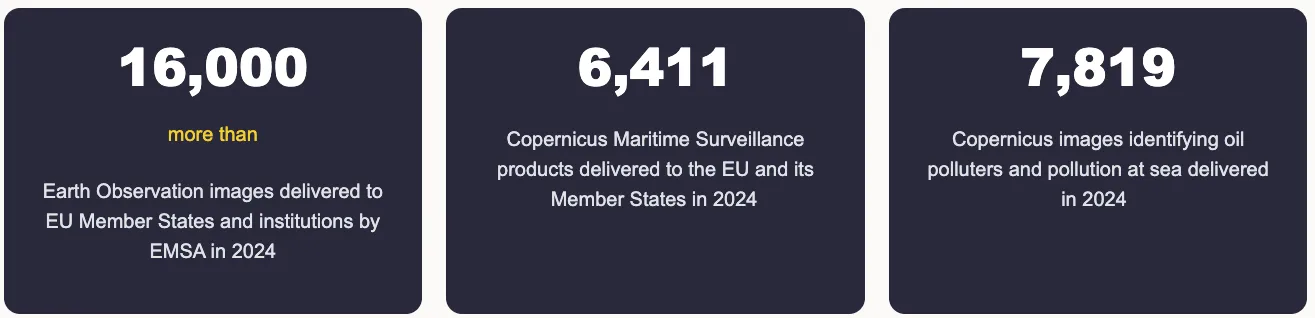
A Key Metrics Content Row is a strip of headline numbers — “12 satellites in orbit”, “98% global coverage”, “3 billion measurements / day”. Each number is a Key Metric Item nested inside the row. Use it on landing pages to surface programme-level achievements without long text.
When to use
Use it for a small set of verified figures or icons that communicate achievements at a glance. Do not use it for detailed statistics, unverified estimates, or values that require a long qualification; present those in explanatory text or a data visualisation instead.
Steps
1. Add the row
In Content items, click Add Key Metrics Content Row.
A row block appears with:
- The row’s own fields (Title, Render as H3, Layout / background colour).
- A panel labelled Items with the button Add Key Metrics Content Item.
2. Fill the row header (optional)
- Title — section title above the strip (“Programme by the numbers”). Optional.
- Render as H3 — tick when nested under another heading.
3. Add the first metric
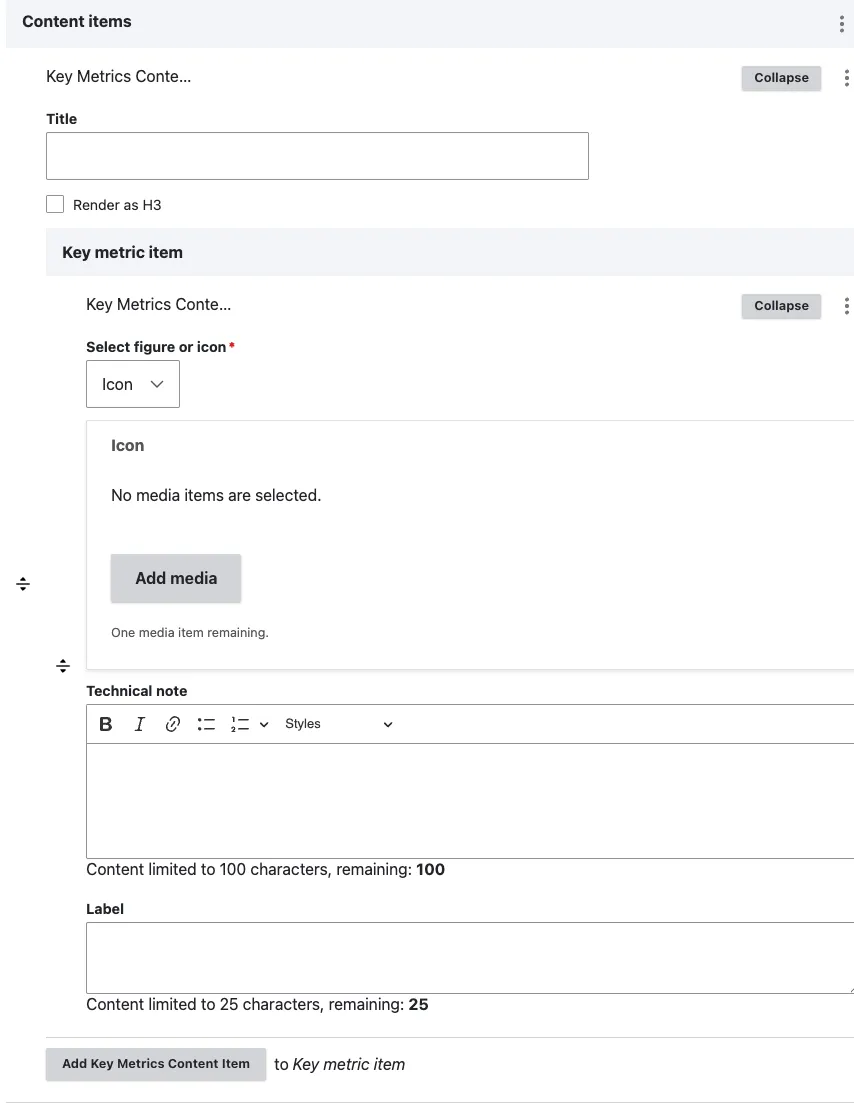
Click Add Key Metrics Content Item. A sub-form opens with the following fields:
- Select figure or icon — a toggle that controls whether the item shows an icon or a figure. Icon is selected by default.
- Icon — opens the media library, filtered to the Icon bundle. Pick or upload an icon to display above the figure.
- Figure — the large number or short string. Examples:
12,98%,3B,€2.4 bn. Keep it short, as it renders in a very large type size. - Label — the descriptor under the figure (e.g. “satellites in orbit”, “global coverage”). One short line.
- Technical note — a short text, limited to 100 characters.
4. Add more metrics
Click Add Key Metrics Content Item for each additional number. Drag the row handles to reorder.
5. Save
Click Save on the page-editing form.
Field explanations
| Field | What editors should enter or select |
|---|---|
| Row Title | An optional heading above the metric strip. |
| Render as H3 | Select when the row belongs under an existing H2. |
| Layout / background colour | Selects the standard or grey background for the complete row. |
| Select figure or icon | Chooses whether the item leads with a large figure or an icon. |
| Icon | An icon selected through the media library when the icon presentation is used. |
| Figure | A short number or value, such as 98% or €2.4 bn. |
| Label | A brief description that explains what the figure or icon represents. |
| Technical note | Short public-facing supporting text, limited to 100 characters. |
Common mistakes
- Long figures. “1,234,567 km²” reads poorly at the large type size. Round and abbreviate: “1.2M km²”.
- Mixing units inconsistently. If three items use
%and one usesmillion, the strip feels unbalanced. Pick a unit family and stick with it.
Tips
- Round generously — “98%” reads better than “97.6%”.
- Pair the row with a Structured Content Section that explains what the numbers mean — bare numbers don’t convince on their own.
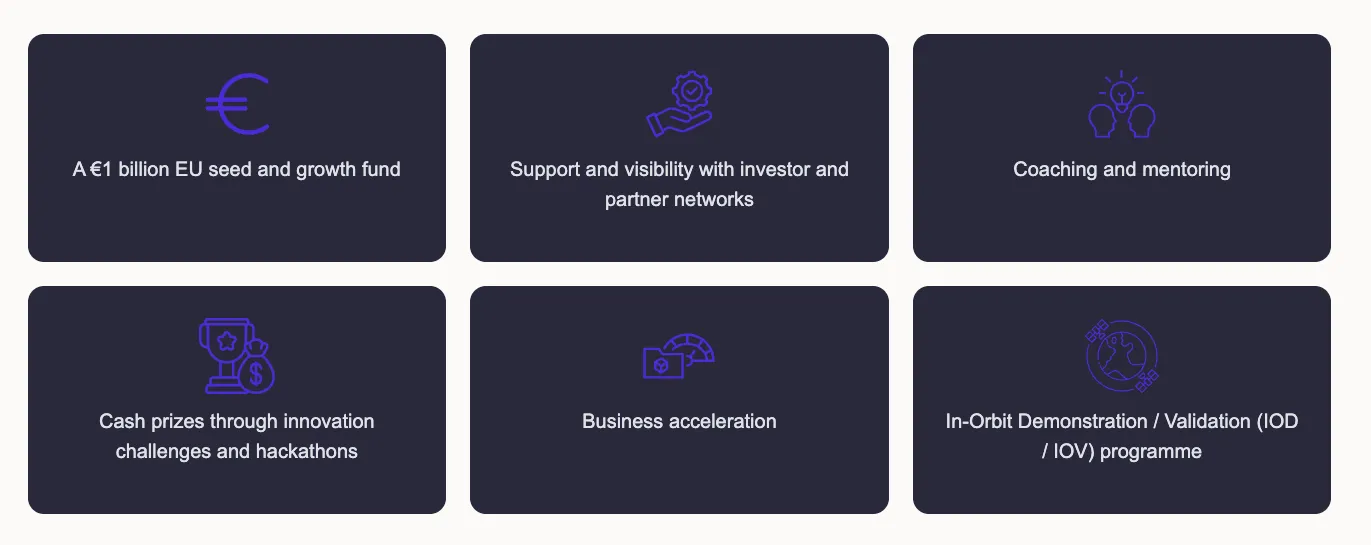
- Icons are more cohesive — either use icons on every item or on none.
Example
These examples show the figure-based and icon-based presentations available to a Key Metrics row.